Welcome to the review of our year in 2020/21
Looking for our latest annual report? Our 2022/23 report is available now.
Introduction

Chief Executive
It is difficult to describe the 12 months from April 2020. Certainly when the HIN was planning for 2020/21 it could not have imagined everything that would occur as a result of Covid-19. Although I joined in March 2021 it was clear that our response to the pandemic had been swift and valuable for our members and for that I want to thank Zoe Lelliott in her role as acting Chief Executive.
While this year has been unusual, our response to it has been extraordinary. The HIN planned for a normal year and got anything but. Midway through the objectives were reviewed to reflect the agile way the HIN was supporting members and partners though Covid and focus on:
- Digitally enabled remote working.
- Long-term conditions and self-management.
- Evidence generation and evaluation.

Chair, Health Innovation Network
It is difficult to summarise the last year, particularly when we are yet to understand the full ramifications. What is clear though is that while we have now seen off the immediate threat posed by Covid, we will be living with the after-effects of the pandemic for some years.
But while it would be easy to focus on the challenges ahead, our annual report gives us the opportunity to reflect on the previous 12 months. While it was difficult, I have been proud of the contributions of those in the HIN to help the wider health and care system navigate the uncertainty and ensure people were cared for whether that was through using apps, video calls for appointments, or medical devices in their homes like oximeters.
Thank you to everyone for helping each other and the system in these uncertain times. I would especially like to thank Zoe Lelliott, who was our fantastic acting CEO for two years, including throughout the pandemic and did an amazing job of steering us through that, as well as helping shape the HIN in her role before that.
We are still too close to the pandemic to grasp the lasting change it has made. However, I hope in time we are able to take stock and use the examples contained within this report to be proud of our response as individuals, as an organization and as a partner supporting the care of south Londoners.
Digitally enabled remote working
The pandemic severely restricted face to face caring and support. Here we demonstrate how our projects supported remote working, including remote consultations for those needing mental health support and the monitoring oxygen levels of patients with Covid in their own homes, or on virtual wards.
Matt Inada-Kim, Irem Patel & Catherine Dale
Learn more about the project from our Head of Digital Transformation & Technology
349
resource downloads71
graduates placed in 27 Trusts and healthcare organisations across the UK since 2018, with a 145% increase in yearly placements from 2018-19 to 2020-21.-
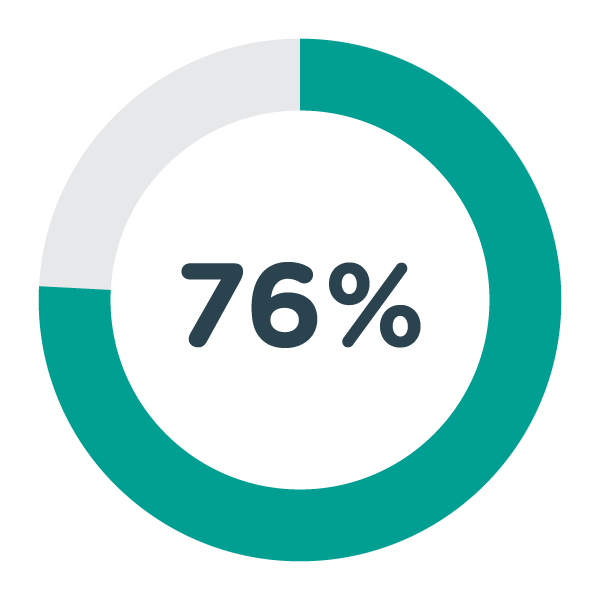
76% of scheme applicants pass the EPIC “Sphinx” qualification test, compared to 45% of applicants through NHS Jobs
-
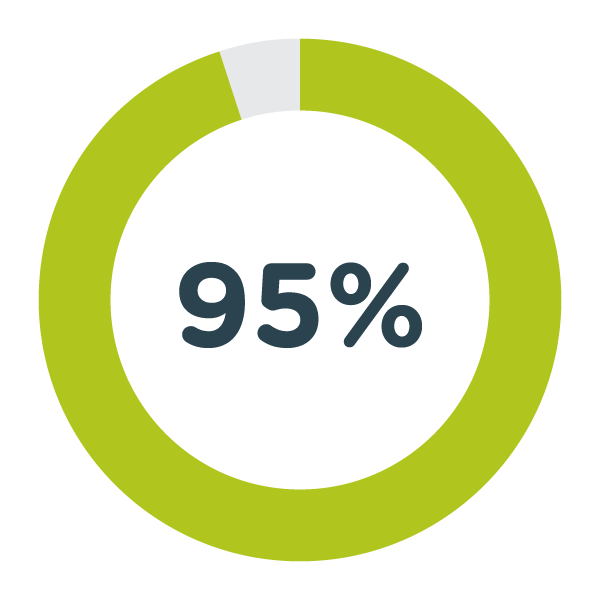
Advertise through 95% of universities across all regions in England and attract over 5,000 technical applications each year
-
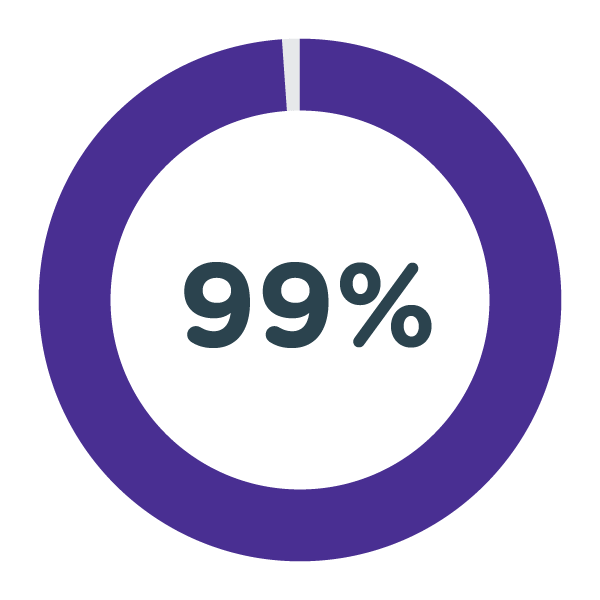
99% of current graduates on the scheme tracking toward Band 6/7 roles (this means that during the two year role they consistently perform at a higher band than they were recruited to)
-

100% success rate in recruiting and training cyber security professionals from Band 5 to Band 6
Learning from evaluation
Covid-19 turbo-charged the use of remote consultations in mental health, with many services having to switch to video or telephone appointments almost overnight. But what has this meant for service users and staff, and what lessons can we take for the future? Since summer 2020, the HIN has worked closely with south London mental health providers, local system partners, academics and service users to try and answer these questions and disseminate best practice – this is an important part in developing towards being a true learning health system. The project is ongoing, but key activities so far have included:- Two shared learning webinars attended by more than 330 clinicians, commissioners and service users.
- Delivery of a rapid academic review of pre-Covid literature.
- Co-production (with service users) of academic research summaries.
- Hosting a dedicated online resource hub with materials including best practice guides and reports, which has been visited almost 3,000 times.
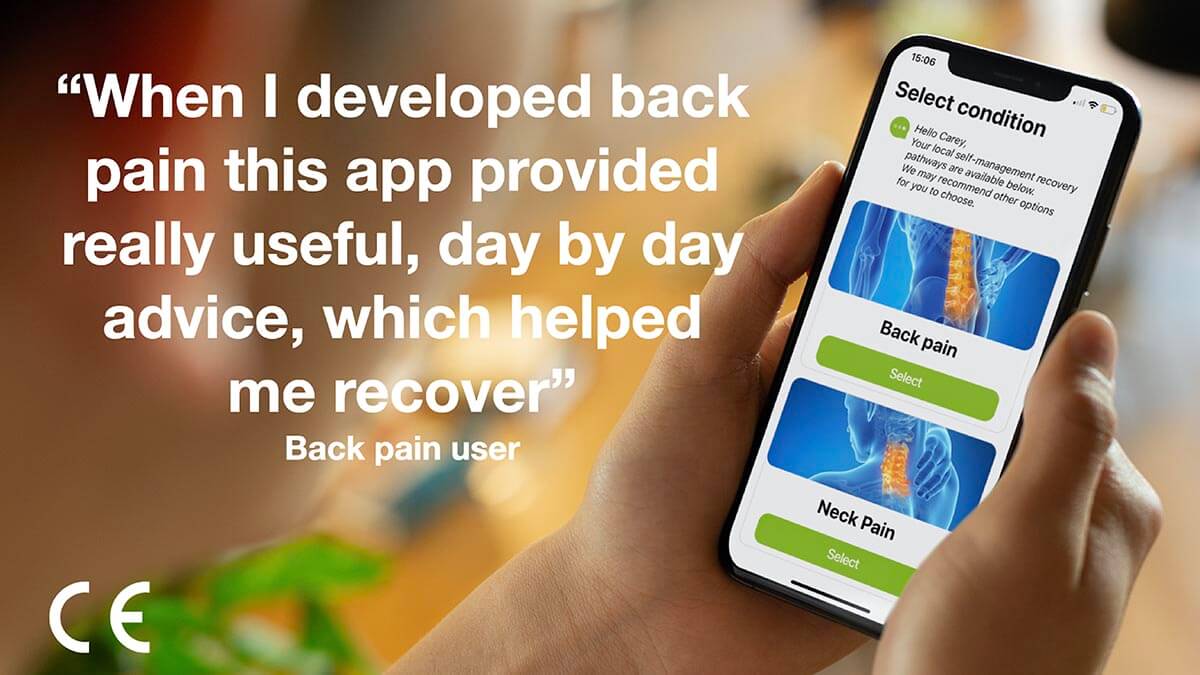
Long-term conditions and self-management
These programmes and projects looked at how to maintain safe and effective care, initially in the context of a very different model of healthcare being delivered due to the pandemic, but also demonstrate the possibilities of how to deliver care post-pandemic.
35
patients suffering with severe cluster migraines benefited from the non-invasive Gammacore- 35 patients suffering with severe cluster migraines benefited from the non-invasive Gammacore.
- 248 patients with suspected coronary artery disease benefited from Heartflow.
- For Multiple Sclerosis patients in south London our providers are in the highest quartile for prescribing of Cladribine nationally.
- Adoption of the NICE-endorsed clinical lipids optimisation pathway has led to 74 per cent increase for patients with high cholesterol to benefit from the PCSK9I inhibitors.

4,317
resource page views
100%
of 41 surveyed participants said they would recommend the programme to others-
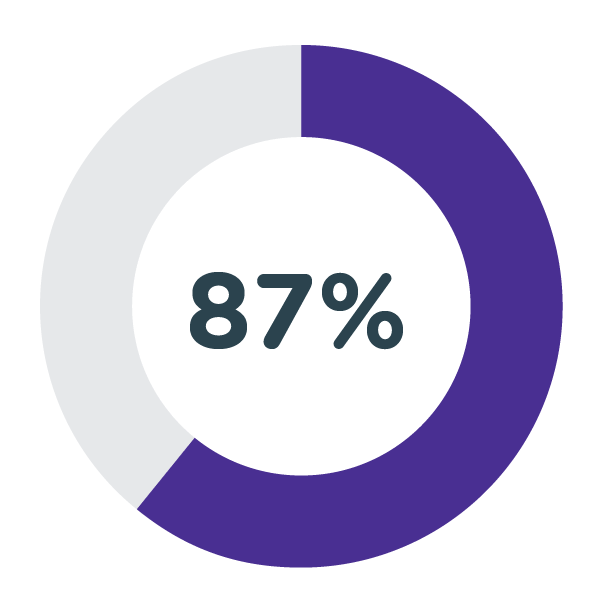
87% completion for 31 ‘Decathletes’ in the face-to-face programme; 100% completion for 10 Decathletes in virtual programme (comparable programmes show 27% completion).
-

38.6kg group weight loss from 27 out of 31 participants and 18.3kg group weight loss from 10 participants measured in respective pilot programmes
-

70% of face-to-face and 100% of virtual participants from Black, Asian or minority ethnic backgrounds, with 70% and 100% respective retention rates.
-

One million steps walked by participants in a single week of the face-to-face programme with 40% overall increase in activity throughout the programme.

-
124
innovators benefitted from individual advice and sign posting (19% more than in 19/20) 
-
124
Our innovator clinics continue to be popular with 124 new innovators seen by the innovation and clinical teams during 20/21
-

2,302 bookings on virtually and digitally delivered courses in 2020/21.
-

Uptake of digital diabetes education grew by more than 130 per cent from 823 in 2019/20 to 1,950 in 2020/21.
-

Health checks in 441 people were completed across six health clinics at local Black Caribbean and Black African Churches, a Tamil temple and two mosques.
-
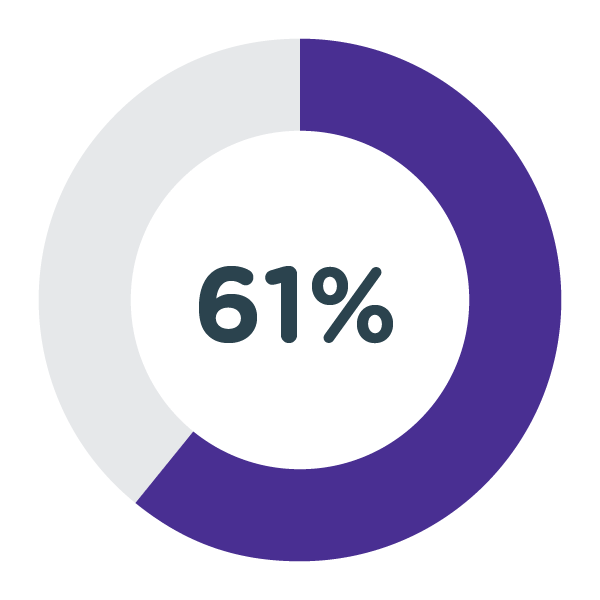
61 per cent of participants were detected with a high or moderate risk of Type 2 diabetes using the Diabetes UK ‘Know Your Risk’ tool;
-
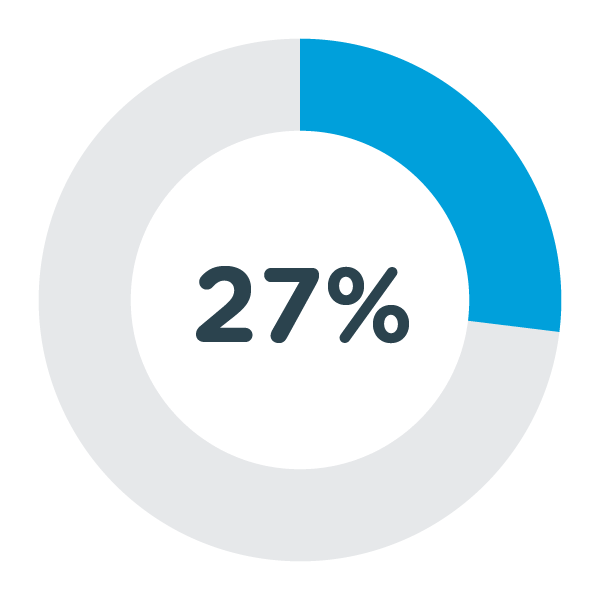
27 per cent had a blood pressure of >140/90 indicating possible hypertension.
-
Of the 209 patients seen in clinic, 190 were using the GDM sugar monitoring health app over an 11 week period:
-

Reduction in the number of patients booked per clinic, as many women are reviewed remotely by using the GDM app technology, or are reviewed ad-hoc using the call back service for concerns.
-

Average number of patients per clinic reduced to 14, from 16 in 2019.
Evidence generation and evaluation
We want to understand the impact of rapid service changes and build an evidence base for digital tools that can help commissioners, clinicians and partners take key learnings from the pandemic and enable them to make informed choices going forward. Here we have some examples of this important work.

- Designing an architecture for joined-up data across London to support individual care. The London Care Record - a single shared care record - now covers a population of 7.5 million Londoners.
- Beginning to configure a London data services layer, using de-personalised (non-identifiable) information to support planning, improvement, and research.
- Initiating planning for a pan-London approach to personal health records.
-
21,000
people in south London expected to have undiagnosed atrial fibrillation, which is 32% of all people with AF 
-
>14%
of people in south London who have a diagnosis of AF, are not receiving protective oral anticoagulation therapy
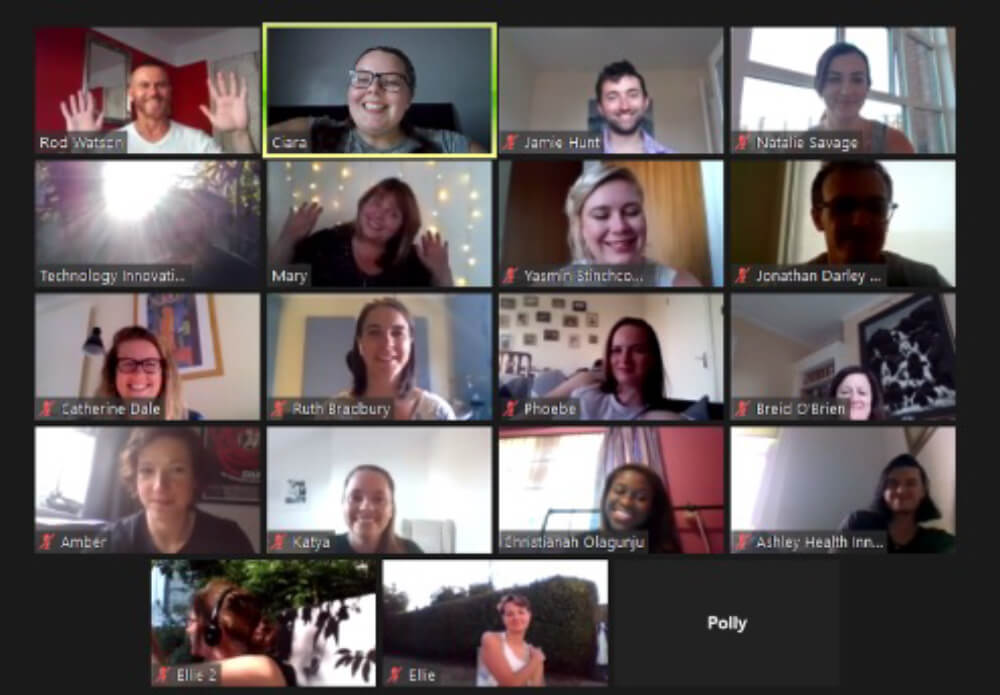
Finance and People
Our work looks at how innovation can improve the lives of patients and staff within the NHS. As an employer we want to make sure we carry that through to our own colleagues at the HIN. This section gives the details on the amount of people at the HIN and examples of the work we do to support them.
 We have also delivered the following Awareness Campaigns:
- HIN Pride including an eight-step guide to allyship, playlist, book list, film list and celebrations.
- Black History Month – weekly profiles of GSTT/HIN staff and historical innovators, internal and external presentations, focussed book club, reading list, playlist, and film list.
- LGBT+ History Month including profiles, playlist, book list, film list.
- Random Acts of Kindness Campaign.
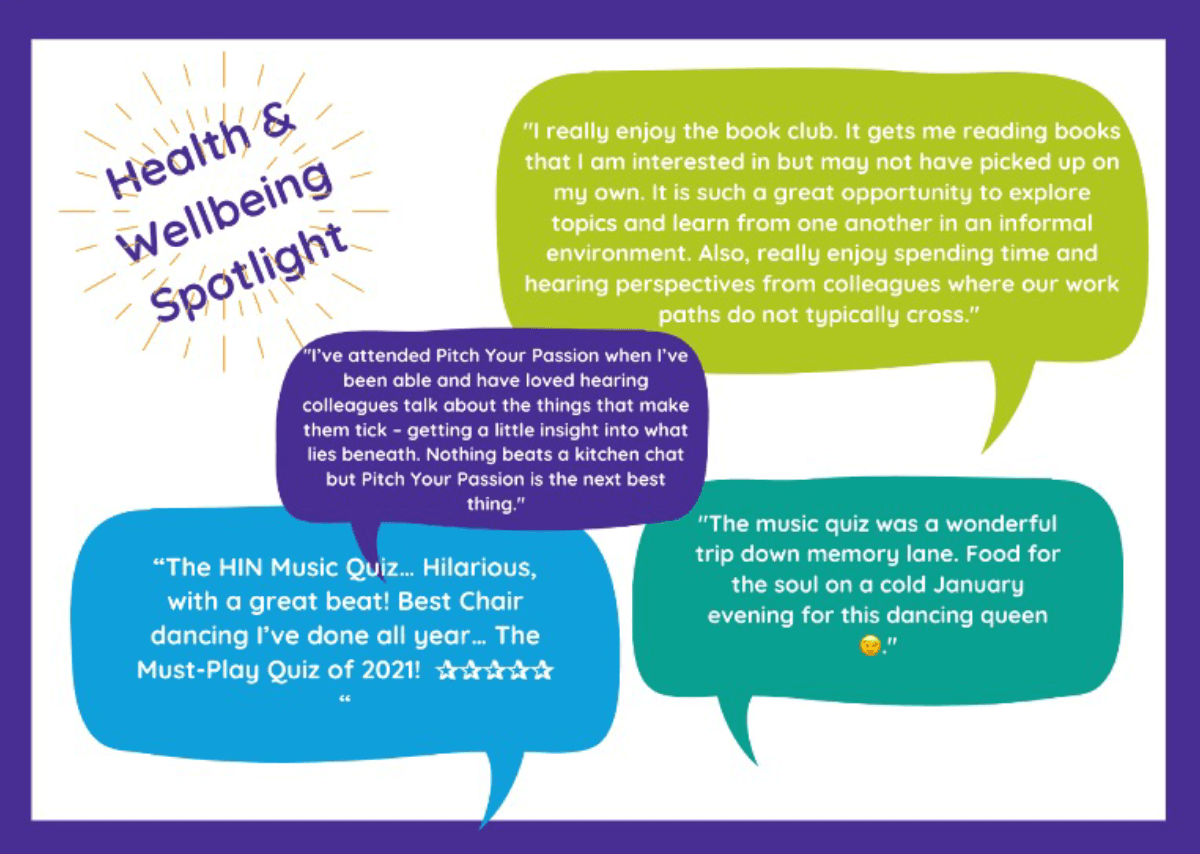 A number of other resources, initiatives and events have been produced or hosted:
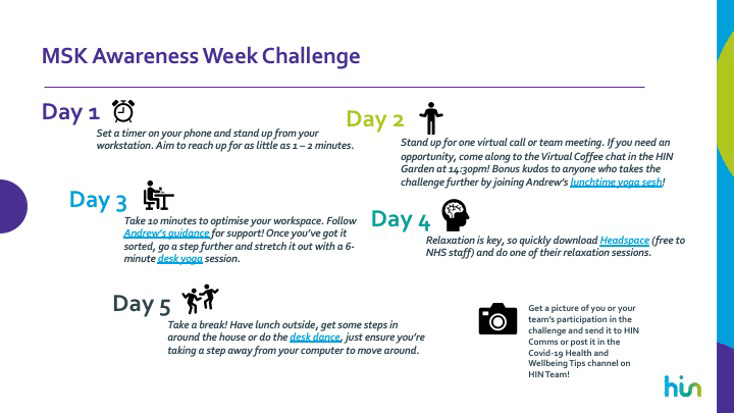
- Working from home guide/top tips.
- Co-developed King’s Health Partners tips, workstation set-up advice.
- Shared wellbeing apps and resources.
- Hosted a presentation by a sleep consultant.
- Facilitated a ‘Fireside Chat’ on dealing with death & difficulty.
- Introduced Health and Wellbeing inductions for all new HIN starters.
- Introduced Quarterly Wellbeing Weeks.
- Promoted NHS OneYou Programme.
- We commit to implementing a recognised process to self-assess and improve equality performance in each of our organisations.
- We commit to empowering and supporting our staff to be positive role models for equality and diversity.
- We commit to understanding the impact of our work on all members of our communities and for our work to reflect the equality and diversity within these communities.
- Ensuring all new projects have an Equality Impact Assessment (EIA).
- Appointing a Speak Up Advocate to ensure that staff can raise any concerns.
- Including panel members who identify as being from an ethnic minority in all our interviews as standard and have a pool of trained panel members to help us make this possible.
- Members of the leadership team are participating in a reverse mentoring programme.
- All staff have received unconscious bias training.
- Focus on continuing to deliver value for money to our members and funders in the current, challenging environment.
- Continue to engage across the system, building on past success and seeking new funding, as a number of key existing projects come to an end.
- Closely monitor our cost base to ensure that we continue to be sustainable long term.
- Be open on information about our gender and ethnicity equality information.
Finance tables
- Expenditure
- £’000
- PayNon-PayTotal
- Stroke Prevention
-
979106
- Diabetes
-
330170500
- Patient Safety & Experience
-
665177782
- Healthy Ageing
-
330101431
- Mental Health
-
23394327
- MSK
-
48362544
- Innovation
-
31862380
- Diabetes
-
407136544
- Graduates into Health
-
407136544
- Technology
-
3316337
- Informatics
-
2110211
- Digital Health.London Accelerator
-
731179910
- Evaluation
-
127-127
- Techforce
-
-507507
- Central Costs
-
8019381,739
- Corporate Support
-
422-422
- Communications
-
407136544
- Total
-
5,7162,5428,258
- Income
- £’000
- Core Income
- 4,411
- Membership
- 444
- Other NHS
- 1,038
- Universities
- 33
- Third Sector
- 254
- Escape Pain
- 107
- Graduates into Health
- 502
- ERDF
- 579
- Industry
- 78
- Techforce
- 519
- Total
- 7,965
Pay gap
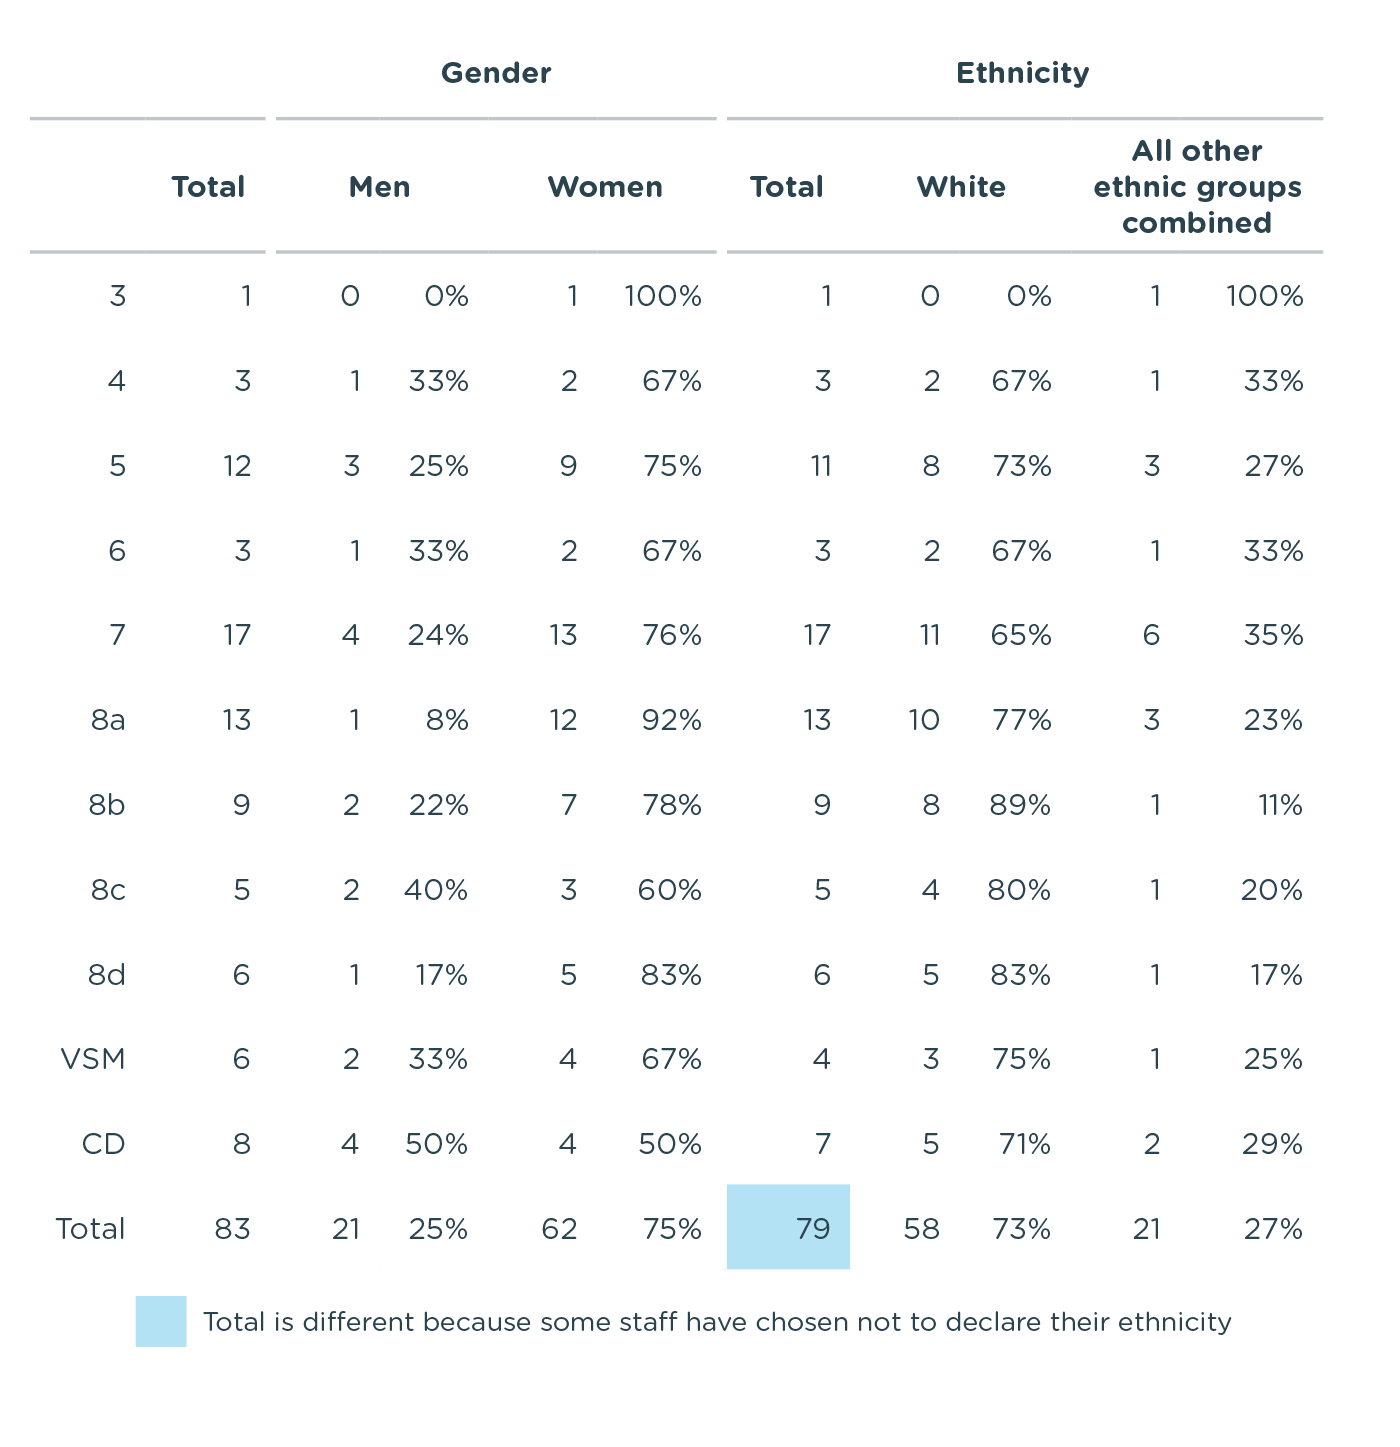
Mean: Men 20% higher than women (last year the mean hourly rate for hourly rate for women was 4.9 per cent more than men).
Median: Men 31% higher than women (last year the median hourly rate for women was 2.6 per cent higher).
Mean: Those who identify as white 2% higher than those who identify as being from an ethnic minority (this is the first time we have reported this figure).
Median: Those who identify as white 14% higher than those who do identify as being from an ethnic minority (this is the first time we have reported this figure).
It is worth noting that this is driven by salaries across a range of staff roles and working patterns.
Breakdown of Diversity by band